Strange By Design
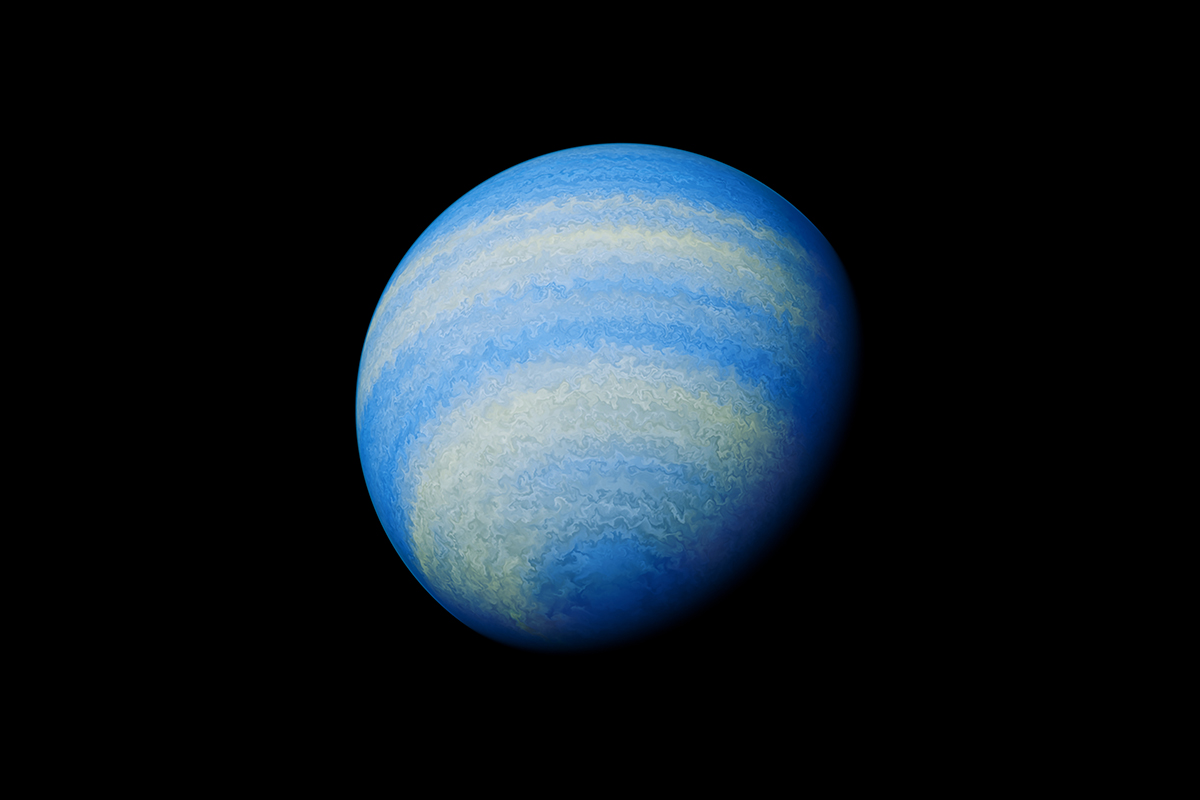
Exoplanets are worlds orbiting stars beyond the Sun, and the oddest examples often look strange because their stars sit dangerously close. HD 189733 b circles its star in 2.2 days and sits about 0.03126 astronomical units away. NASA classifies it as a gas giant, yet its cobalt color comes from a hot, hazy atmosphere rather than an ocean. The color misleads. Its clouds may contain silicate particles, the same broad family of material found in glass.
Distance changes the way astronomers describe these places. No probe has sampled a cloud on HD 189733 b, so researchers combine transit depths, infrared brightness, spectra, and orbital timing. A change of one part in 10,000 in starlight can reveal a planet crossing its star. The method turns faint signals into estimates of size, mass, heat, and chemistry, but every estimate has limits. That distinction matters.
These worlds are not odd because they break physics. They are odd because planetary systems explore combinations that the Solar System rarely shows. A planet can be larger than Jupiter, orbit in 1.1 days, and lose gas to its star; another can be rocky, nearly twice Earth's width, and hot enough for molten rock. Such contrasts make exoplanets useful tests of how worlds form and change.
Why They Seem Impossible
Popular descriptions compress careful measurements into memorable images. “Glass rain” is a shorthand for a model involving silicate clouds and violent winds, not a forecast made by a weather station. WASP-12 b is called pitch-black because Hubble observations found it traps at least 94 percent of visible starlight on its day side. Darkness here comes from absorption in a superheated atmosphere, not from a solid black surface.
Heat also changes familiar categories. KELT-9 b reaches about 4,300 degrees Celsius, hotter than many stars' surfaces, and its day-side hydrogen molecules are expected to split into atoms. On the night side, some atoms can recombine before circulation carries them back into daylight. The planet is still a gas giant, but its atmosphere behaves like a repeating chemical furnace. That is a physical process, not a science-fiction effect.
Researchers must also separate an observation from an interpretation. A telescope can measure a brightness curve or an absorption line; a climate model may infer clouds, winds, or lava. Several models can fit the same data. A careful article labels the difference, reports the measured quantity, and avoids turning an artist's illustration into a photograph.
How To Read Evidence
Start With The Orbit
Begin with the orbital period and distance from the host star. A short year usually means intense irradiation, tidal locking, or both. WASP-12 b completes an orbit in about 1.1 days, while 55 Cancri e circles its star in roughly 17 hours and 40 minutes according to early NASA summaries. Those numbers explain why one hemisphere may face permanent daylight and why heat can dominate the planet's surface conditions.
Orbital shape matters too. An eccentric orbit changes the heating schedule, while a near-circular orbit can keep the forcing steady. The star matters just as much: ultraviolet output, age, size, and activity shape atmospheric loss. Read the orbit before accepting a dramatic climate label.
Separate Size From Surface
A transit measures how much starlight a planet blocks, which gives its radius relative to the star. Radial-velocity measurements track the star's motion and help estimate planetary mass. Together, radius and mass suggest density. A large radius does not prove a rocky surface, and a small radius does not prove Earth-like conditions.
55 Cancri e illustrates the problem. NASA describes it as a super-Earth nearly twice the size of Earth, but the phrase describes scale, not habitability. Spitzer data indicated a day side near 2,700 Kelvin and a night side near 1,400 Kelvin in one analysis. At those temperatures, a rocky surface could host lava, although atmospheric circulation and changing observations complicate the picture.
Check The Wavelength
Visible light, infrared light, and high-resolution spectra answer different questions. Hubble measured the visible color of HD 189733 b, while infrared observations estimate heat emitted from a day or night side. Sodium absorption helped researchers infer winds exceeding 5,400 miles per hour around that planet. The instrument and wavelength belong beside the claim.
Data quality sets another boundary. A spectrum with a shallow feature may support several atmospheric compositions. The James Webb Space Telescope's newer observations can refine a model, but they do not erase uncertainty by magic. A sensible reader asks how many observations support a conclusion and which alternatives remain open.
Label The Confidence
Use three mental labels: measured, inferred, and speculative. “The orbit lasts 2.2 days” is measured from repeated transits. “Silicate clouds may create the blue color” is an inference tied to atmospheric models. “The planet rains glass” is a vivid interpretation of that inference. The wording should match the evidence.
This habit prevents a common error, which, frankly, most people skip when reading a viral headline. It also makes old discoveries useful: a 2013 result can remain sound while a later study revises its atmospheric explanation. Dates belong in the note, especially when observations span more than a decade.
Compare Like With Like
Build comparisons around shared measurements rather than adjectives. Put orbital period, radius, mass, temperature, and evidence type in one table. A hot Jupiter and a lava-rich super-Earth should not be ranked by “weirdness” alone. Their differences may reflect mass, composition, stellar distance, or the limits of present instruments.
Use units consistently. Convert Fahrenheit and Celsius only when it helps the reader, and retain the original reported unit when source context matters. A version number such as JWST cycle 1 can date a dataset without turning the article into a telescope manual. The small detail clarifies provenance.
Case Studies
Imagine an astronomy club comparing two headlines about HD 189733 b. One says the blue planet has glass rain; the other says its atmosphere may contain silicate particles and has winds above 5,400 miles per hour. The second headline is less theatrical but more useful. It connects a visible color measurement to a model and a measured velocity to a named spectroscopic method.
Now imagine a student reading that 55 Cancri e is a “second Earth.” The label would be misleading. Its radius is about twice Earth's, its orbit lasts under 18 hours, and its thermal conditions are hostile to known life. A better conclusion is that it is a nearby laboratory for studying hot rocky planets, with a surface and atmosphere still under investigation.
A third reader sees an illustration of WASP-12 b stretched like an egg. The shape is not a camera image. It represents tidal forces inferred from a planet orbiting roughly 2 million miles from its star. The same reader can accept the model while remembering that the planet's observed darkness and mass-loss evidence come from different observations.
Compare The Worlds
| World | Standout trait | Useful measurement | Confidence note |
|---|---|---|---|
| HD 189733 b | Blue, glass-rich haze | 2.2-day orbit; 5,400-mph winds | Cloud details remain modeled |
| WASP-12 b | Traps visible light | 1.1-day orbit; 94% absorption | Atmosphere is escaping |
| KELT-9 b | Molecules split by heat | About 4,300°C day side | Thermal chemistry is inferred |
| 55 Cancri e | Possible lava surface | About 17 hours 40 minutes | Surface picture has evolved |
Use the table as a reading aid, not a league table. The four planets were studied with different instruments and models, so their figures are not a single controlled experiment. A reader comparing them should check the publication date, unit, and measurement type before drawing a broad conclusion, which, annoyingly, can create false precision.
Common Mistakes
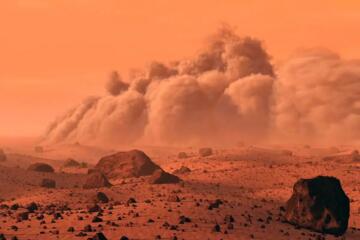
The first mistake is treating an artist's concept as direct evidence. Illustrations help people imagine an unseen world, but colors, clouds, and terrain may be choices made for clarity. Look for a caption and then find the observation behind it.
The second is confusing “possible” with “confirmed.” NASA's descriptions of lava on 55 Cancri e reflect evidence and models, not a rover's photograph. Likewise, sideways glass rain is a plausible account of silicate clouds and wind, not a recorded precipitation event. Precision in verbs improves the whole explanation.
The third mistake is using a single temperature as a planet-wide average. Tidally locked planets can have day-side and night-side extremes, while winds redistribute heat. KELT-9 b's molecule-splitting cycle shows why one number cannot describe every altitude or hemisphere.
The fourth is assuming “odd” means “rare.” Detection favors large planets close to bright stars because their signals are easier to measure. The catalog may therefore overrepresent dramatic hot worlds. Selection effects shape the list.
Finally, do not turn a hostile planet into a travel pitch. A world 63 light-years away with 1,000-degree-Celsius air is a scientific target, not a destination. The practical lesson is to admire the evidence while respecting its limits.
FAQ
Which Exoplanet Has Glass Rain?
HD 189733 b is associated with possible sideways glass rain because models link its blue haze to silicate particles and its winds to speeds above 5,400 miles per hour.
What Is The Darkest Known Planet?
WASP-12 b is among the darkest measured exoplanets; Hubble reported that it traps at least 94 percent of visible starlight on its day side.
Which Planet Is Hottest?
KELT-9 b has been measured at about 4,300 degrees Celsius on its day side, hot enough for hydrogen molecules to split and later reform on the night side.
Could 55 Cancri E Have Lava?
Yes, lava is a leading interpretation of its extreme day-side heat, though atmospheric conditions and later observations mean the surface model remains open to revision.
How Do Astronomers Study Them?
They combine transit and radial-velocity data with visible, infrared, and high-resolution spectra to estimate size, mass, temperature, winds, and atmospheric chemistry.
Author's Insight
The strangest planets are useful because each one isolates a different physical question. HD 189733 b tests atmospheric circulation, WASP-12 b shows how a star can strip a close companion, KELT-9 b exposes chemistry under stellar-level heat, and 55 Cancri e tests models of rocky worlds. Their headlines are memorable, but their measurements carry the lasting lesson. Good exoplanet reading keeps wonder and uncertainty in the same paragraph.
Key Takeaways
Odd exoplanets are not magic exceptions; they are natural experiments shaped by orbit, mass, composition, and stellar radiation. Compare measured values first, then label the models built from them. Glass clouds, black skies, molten rock, and broken molecules can all describe serious research when the wording states what observers saw and what scientists inferred. The most reliable account leaves room for the next observation.